Ďakujeme za prednášky: doc. Chovanec, doc. Dedera a cvičenia Dr. Ondis:
https://hrubos.tech/blogy/content/images/20260127115924-geometricky-integral-solution.png
https://hrubos.tech/blogy/content/images/20260127120027-geometricky-integral-sol-numeric.png
using Pkg
Pkg.add("Plots")
using Plots
# interval boundaries
a = 0.0
b = log(2)
# number of rectangles
n = 40
Δx = (b - a) / n
# x positions (left Riemann sum)
xs = a:Δx:(b - Δx)
# functions
f(x) = exp(2x)
g(x) = exp(x)
# rectangle heights
heights = f.(xs) .- g.(xs)
# Riemann sum (area approximation)
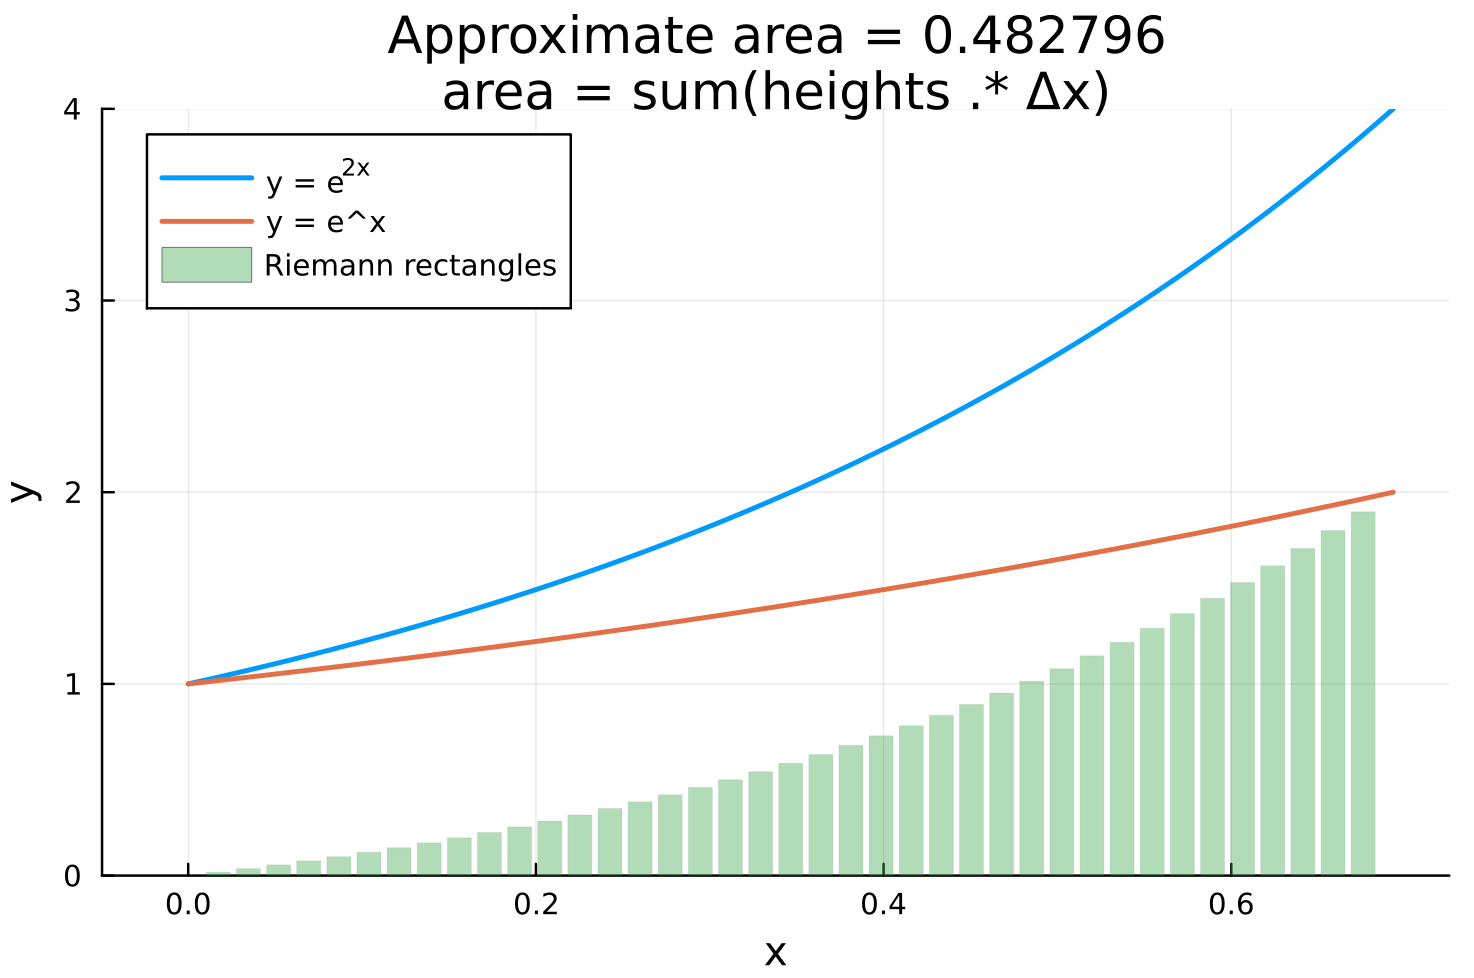
area = sum(heights .* Δx)
println("Approximate area = ", area)
# fine grid for smooth curves
xplot = range(a, b, length = 400)
# create plot
plt = plot(
xplot,
f.(xplot),
label = "y = e^{2x}",
linewidth = 2
)
plot!(
plt,
xplot,
g.(xplot),
label = "y = e^x",
linewidth = 2
)
# Riemann rectangles
bar!(
plt,
xs,
heights,
width = Δx,
bottom = g.(xs),
opacity = 0.4,
label = "Riemann rectangles"
)
xlabel!(plt, "x")
ylabel!(plt, "y")
#title!(plt, "Geometric Riemann Sum: Area between e^x and e^{2x}")
# correct title with interpolation
title!(
plt,
"Approximate area = $(round(area, digits=6))\narea = sum(heights .* Δx)"
)
# save to PNG
savefig(plt, "riemann_area.png")
println("Plot saved as riemann_area.png")
println("Press Enter to exit...")
readline()
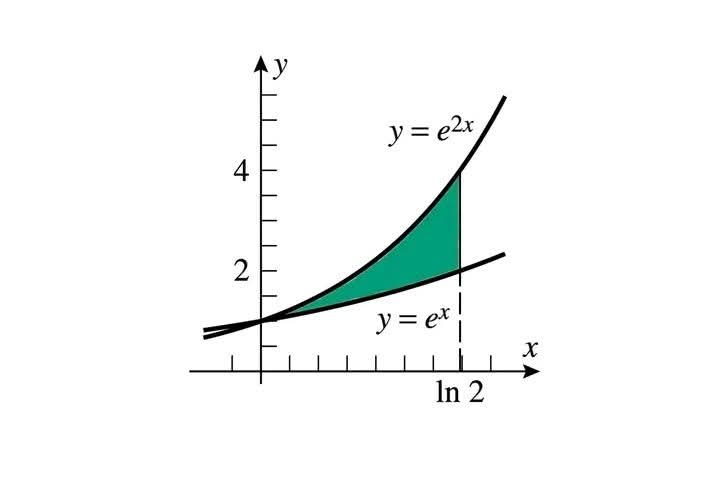
Comments “Dnes si dajme niečo z tretieho semestra matematiky na mojej prvej VŠ, a síce, ako sa rieši plocha pod grafmi pomocou dvojných integrálov numericky aj graficky”